POW Help Page
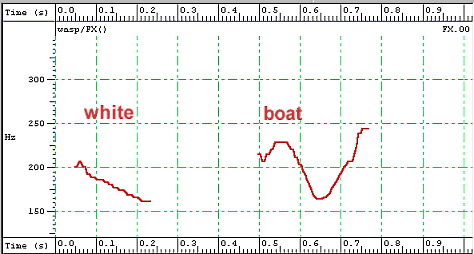
Diagrams If you see an icon which looks like this:  you can click on it to see a diagram. These are mainly graphs of the fundamental frequency contour of an utterance and they look like this: you can click on it to see a diagram. These are mainly graphs of the fundamental frequency contour of an utterance and they look like this:
 
The horizontal axis represents time in seconds and the vertical axis represents fundamental frequency in Hz (Hertz). 1 Hz = 1 cycle of vibration per second. The higher the fundamental frequency, the higher the pitch you hear. The example is the phrase white boat, which is an utterance taken from Exercise 5 in Tutorial 3. Click on the loudspeaker icon to hear it.
Dictionary:  Clicking on this icon will take you to a dictionary of technical terms used in phonetics, phonology and speech science. Clicking on this icon will take you to a dictionary of technical terms used in phonetics, phonology and speech science.
Extra practice: Clicking on this icon will take you to another website where you can find more practice on the topic. Clicking on this icon will take you to another website where you can find more practice on the topic.
Navigation: The navigation icons at the left of the screen are as follows:
 |  |  |
| Previous page | Next page | Back to POW Home Page |
Sound:  Clicking on this icon will play the associated sound clip. Please be patient while the sound loads. The time this takes depends on how busy the network is and is beyond our control. Clicking on this icon will play the associated sound clip. Please be patient while the sound loads. The time this takes depends on how busy the network is and is beyond our control.
|


 you can click on it to see a diagram. These are mainly graphs of the fundamental frequency contour of an utterance and they look like this:
 Clicking on this icon will take you to a dictionary of technical terms used in phonetics, phonology and speech science.
 Clicking on this icon will take you to another website where you can find more practice on the topic.

